R. Mullick and H. T. Nguyen
The Visible Human![]() is a vast resource, which few methods can
fully explore and analyze. We aim to completely label and volume
display it; here we discuss the main obstacles, and our means for
overcoming them. Our segmentation into over 350 anatomical regions
spans the various body systems. Volume rendering by a
memory-independent, partitioned, color and translucency scheme gives
realistic human images, with many possibilities for medical education
and ``edutainment''.
is a vast resource, which few methods can
fully explore and analyze. We aim to completely label and volume
display it; here we discuss the main obstacles, and our means for
overcoming them. Our segmentation into over 350 anatomical regions
spans the various body systems. Volume rendering by a
memory-independent, partitioned, color and translucency scheme gives
realistic human images, with many possibilities for medical education
and ``edutainment''.
Keywords
Human Anatomy, Volume Rendering, Visualization, Visible Human,
Segmentation
The Visible Human![]() dataset (VHD) from the
National Library of Medicine [1, 2] is the
much-awaited standard for medical image visualization, analysis, and
registration. The dataset consists of mutually registered MRI, CT, and
high resolution cryogenic macrotome sections of a male
(
dataset (VHD) from the
National Library of Medicine [1, 2] is the
much-awaited standard for medical image visualization, analysis, and
registration. The dataset consists of mutually registered MRI, CT, and
high resolution cryogenic macrotome sections of a male
(![]() ) and female
(
) and female
(![]() ) cadaver. Numerous research and
commercial sites are developing tools to browse, visualize, and label
this gigantic 3D dataset. Although details of segmentation methods
used at various centers are not available in public domain, it appears
that most groups have based their labeling of the VHD on one of the
RGB channels of the macrotome sections. A majority of the groups
report usage of manual methods to achieve this monumental task. The
sheer magnitude of the data offers numerous challenges in management,
visualization and analysis. We have embarked on the task of
completely labeling this data into the various anatomical regions, and
have developed visualization techniques to volume render it in its
entirety. Our approach allows the user to independently specify the
various rendering parameters, and relative translucency, of each
segmented anatomical structure (Figure 3). We present an
overview of our methods for segmentation and visualization of this
data. The challenges faced at each step of this process are discussed
in the relevant sections, followed by proposed ways to resolve them.
) cadaver. Numerous research and
commercial sites are developing tools to browse, visualize, and label
this gigantic 3D dataset. Although details of segmentation methods
used at various centers are not available in public domain, it appears
that most groups have based their labeling of the VHD on one of the
RGB channels of the macrotome sections. A majority of the groups
report usage of manual methods to achieve this monumental task. The
sheer magnitude of the data offers numerous challenges in management,
visualization and analysis. We have embarked on the task of
completely labeling this data into the various anatomical regions, and
have developed visualization techniques to volume render it in its
entirety. Our approach allows the user to independently specify the
various rendering parameters, and relative translucency, of each
segmented anatomical structure (Figure 3). We present an
overview of our methods for segmentation and visualization of this
data. The challenges faced at each step of this process are discussed
in the relevant sections, followed by proposed ways to resolve them.
We have used the full resolution RGB for segmentation of the VHD
section data. The labeling was done manually by drawing Bézier
curves for each anatomical region in the image. Corresponding slices
of the segmented(![]() )-volume and photo RGB sections were then
registered to generate the RGB
)-volume and photo RGB sections were then
registered to generate the RGB![]() volume, which was used for all
volume rendering. An overview of the information flow is presented in
Figure 1.
volume, which was used for all
volume rendering. An overview of the information flow is presented in
Figure 1.
Anatomical regions in each RGB section of the data were outlined manually by students from the Anatomy, Medicine, and other science departments at the National University of Singapore, under the supervision of CIeMed staff. For each structure, the student sketched out one or more Bézier curves, such that the interior of the region corresponded exactly to that of the anatomical feature. This representation of the labeling has infinite resolution and offers easy scalability of any structure, with an option to generate its geometric model. Figure 2(a) shows the liver region outlined for slice 1500 of the dataset. Thereafter, a labeled image is generated for each slice using the control points and label of each contour. This is done in two steps: (i) A connected raster version of each curve is drawn into a blank (or partially labeled) image; (ii) then, an efficient region filling algorithm is used to fill/erase the interiors of each curve with a region-specific label represented by an intensity value. The region filling algorithm robustly handles special cases such as regions with single or multiple hollow interiors.
The stability of the region filling algorithm comes from a two-mode filling technique. Once the closed contours corresponding to each label are drawn into an image, the region filling algorithm begins by employing the traditional parity check method[3] in a left-to-right raster scan. Then, at points of possible ambiguity, defined as boundary locations and pixels adjacent to the boundary, the algorithm employs a ``point in/outside polygon'' test in order to correctly label the underlying region. The result of labeling the slice in Figure 2(a) is presented in Figure 2(b).
Although our segmentation of this dataset is an ongoing process, we have labeled all the visible anatomical structures comprising the primary human systems. They are: (i) Central Nervous; (ii) Respiratory; (iii) Digestive; (iv) Excretory; (vi) Skeletal; (vii) Circulatory; (viii) Endocrine; and (ix) Sensory organs. A Java Applet to view the labeled VH data is available on WWW at http://ciemed.iss.nus.sg/research/brain/IIBA/JavaAtlas/VHD.html.
A majority of the difficulties of this phase were linked to one main issue, the sheer size of this dataset. To flawlessly store, modify, and manage this data requires significant amounts of time, human resources, and hardware. In order to minimize some of this burden, an in-house interactive volume browser was developed. The browser facilitates efficient resource management, with easy search options for volume data and associated anatomical structures. The magnitude of this dataset also pushes the hardware memory requirements far beyond their limits, allowing few ways to simultaneously segment or visualize a particular chunk of data.
We have developed a new volume rendering technique called Partitioned
RGB![]() Volume Rendering of Segmented Data (ParVo) to visualize
the segmented photo images of the VHD. The unique features of this
approach are:
Volume Rendering of Segmented Data (ParVo) to visualize
the segmented photo images of the VHD. The unique features of this
approach are:
The volume rendering method is based on object space projection rendering. This basic approach has been modified to resample all voxels to planes transverse to the viewing direction, then project them onto the viewing plane in back-to-front or front-to-back order using a color blending equation [4]. A detailed description of this method is given in [5, 8]. The following paragraphs highlight the qualitative enhancements to this method.
A voxel based volume of 1-mm resolution of VHD was created from
photo images (as rendered in Figure 3) containing a total
of (586![]() 340
340![]() 1878
1878![]() [3+2+1]) 2.24 Gbytes where each
voxel consists of three bytes for RGB, a two byte label, and one byte
for the grey channel. Hard disk requirements (
[3+2+1]) 2.24 Gbytes where each
voxel consists of three bytes for RGB, a two byte label, and one byte
for the grey channel. Hard disk requirements (![]() 17 Gbytes)
limited us in creating and thus rendering the entire dataset in full
resolution. With a volume dataset of this magnitude, it is not
practical to require that the entire volume be resident in
memory. Hence a divide-and-conquer approach called Partitioned Volume
Rendering [5] was adopted. PaVe4-16 was originally
designed for multi-processor systems, but has been applied quite
naturally and efficiently to a single processor architecture
(ParVo [8]) to handle large datasets. ParVo renders n
slices of data (n depends on the available memory and memory
required to contain each slice) at a time, and merges (blends) each of
them in order to form a final image. The slice, and hence partition,
ordering depends on the viewing direction. ParVo has allowed us to
render the 1-mm resolution multi-Gbyte VHD volume on an SGI
Indigo-2 with 32 MB of main memory in < 3 hours (time estimate
for unoptimized code).
17 Gbytes)
limited us in creating and thus rendering the entire dataset in full
resolution. With a volume dataset of this magnitude, it is not
practical to require that the entire volume be resident in
memory. Hence a divide-and-conquer approach called Partitioned Volume
Rendering [5] was adopted. PaVe4-16 was originally
designed for multi-processor systems, but has been applied quite
naturally and efficiently to a single processor architecture
(ParVo [8]) to handle large datasets. ParVo renders n
slices of data (n depends on the available memory and memory
required to contain each slice) at a time, and merges (blends) each of
them in order to form a final image. The slice, and hence partition,
ordering depends on the viewing direction. ParVo has allowed us to
render the 1-mm resolution multi-Gbyte VHD volume on an SGI
Indigo-2 with 32 MB of main memory in < 3 hours (time estimate
for unoptimized code).
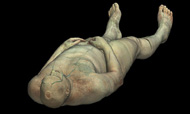
A rendition highlighing many of the over 350 segmented anatomical
structures is presented in Figure 3. This translucent
view (15![]() roll) of the human form clearly
depicts the relative and absolute position of bodily organs with
respect to the skin surface and the skeletal system. Most of the
images presented here have been rendered with a single light source,
Zucker-Hummel gradient estimate, and back-to-front compositing.
roll) of the human form clearly
depicts the relative and absolute position of bodily organs with
respect to the skin surface and the skeletal system. Most of the
images presented here have been rendered with a single light source,
Zucker-Hummel gradient estimate, and back-to-front compositing.
Figure 5 is a detailed the whole body rendered from a
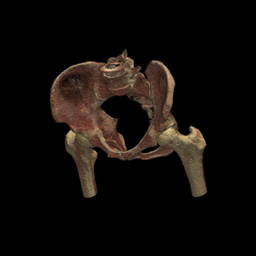
586x340x1878 sized RGB volume. An isolated illustration of the pelvis
region is depicted in Figure 4. This was rendered from
a 1mm-cubic voxel RGB volume of size 320x192x300. An unshaded
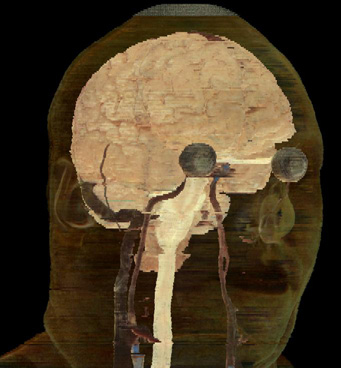
unlighted visualization of the neuroanatomy is illustrated in
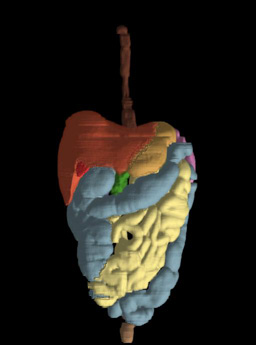
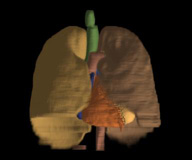
Figure 7. Pseudo-color volume rendering of the blurred
![]() -volume for the digestive and cardio-pulmonary systems is
shown in Figure 6 and
8 respectively. (Additional images and animations can be
obtained via the WWW site at
http://ciemed.iss.nus.sg/research/human_av/human_av.html)
-volume for the digestive and cardio-pulmonary systems is
shown in Figure 6 and
8 respectively. (Additional images and animations can be
obtained via the WWW site at
http://ciemed.iss.nus.sg/research/human_av/human_av.html)
Naming of each skeletal tissue and labeling of the muscular system is also being completed. Other more efficient methods and fidelity enhancement techniques for rendering this type of data are under investigation.
Transformation of the raw VHD into structured geometric objects is vital for all uses beyond passive display. For a simulated catheter to explore its arteries, the arteries' geometry must be known, before it can be translated into force walls that limit the catheter's motion. For the VHD head to smile realistically, the muscles must be mapped and transformed into biomechanical models that contract and bunch up according to suitable virtual force laws and nerve impulses. Transforming the VH into an electronic `crash dummy' depends on passive biomechanics that follow the segmentation into bone, sinus, soft tissue and so on. All such things require, before any progress can be made, an effective segmentation that responds to discontinuity in any data channel (red, green, blue or scan density), and efficient manipulation of the mass of data involved. (Recall also that succeeding data sets will be far larger.) The toolkit described here is a key element in CIeMed's movement beyond visualization, to actively modeled 3D medicine.

Visualization and Labeling of the Visible Human![]() Dataset:
Challenges & Resolves
Dataset:
Challenges & Resolves